Collections
Blog Python Model code and SQLite Database.
- From VSCode using SQLite3 Editor, show your unique collection/table in database, display rows and columns in the table of the SQLite database.
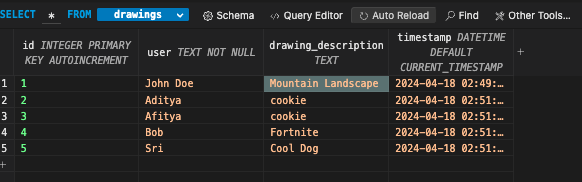
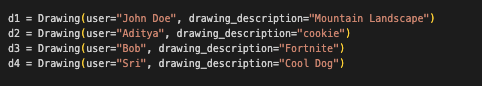
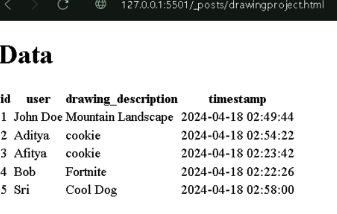
Here is the sql.db that stores the info entered by the drawer. It shows the user, a short drawing description they can answer, id, and a timestamp.
- From VSCode model, show your unique code that was created to initialize table and create test data.
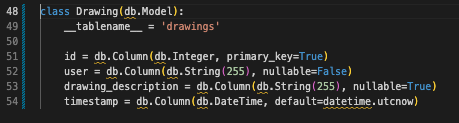
Here is the variables and column names from the db being prepped for the table, setting some of the ones to strings and some of them nullable if the user doesn’t enter any input, and getting the datetime function.
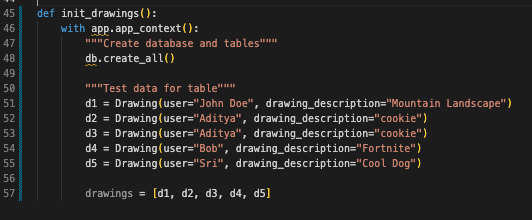
Here is the test data being loaded into the list, initialization code is on top and creating the list is on the bottom.
Lists and Dictionaries
Blog Python API code and use of List and Dictionaries.
- In VSCode using Debugger, show a list as extracted from database as Python objects.
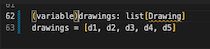
Shows the list “drawings”.
- In VSCode use Debugger and list, show two distinct example examples of dictionaries, show Keys/Values using debugger.
In teh code, there is a class Drawing with a method to_dict() that creates a dictionary representation of a Drawing instance. Each Drawing object can be initialized with a user and a drawing_description. When the to_dict() method is called on a Drawing instance, it returns a dictionary with keys corresponding to the properties of the Drawing object:
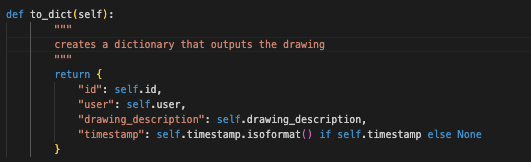
Then, the return functiion outputs all the values and the dictionary with the key values like user and drawing description
APIs and JSON
Blog Python API code and use of Postman to request and respond with JSON.
- In VSCode, show Python API code definition for request and response using GET, POST, UPDATE methods. Discuss algorithmic condition used to direct request to appropriate Python method based on request method.
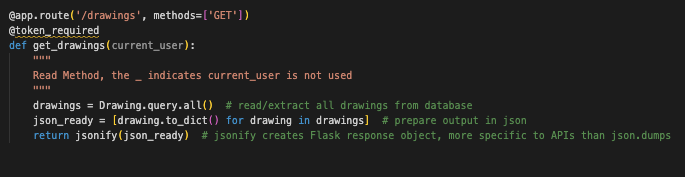 Here is the GET function where it gets the data from “drawings” and prepares the output for json.
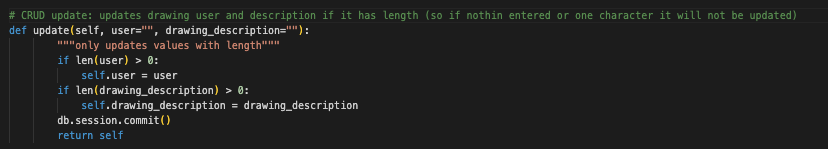
THe update function sees if the name entered and the drawing desc is greater than one, than itll be added to drawing database
- In VSCode, show algorithmic conditions used to validate data on a POST condition.
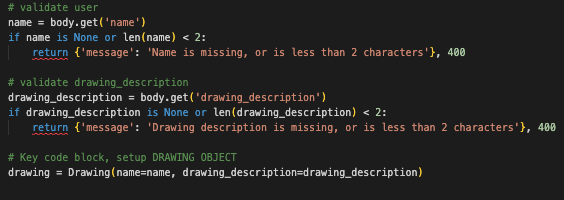
Here is some validation data that checks if the user entry is appropritae for being entered into the database.
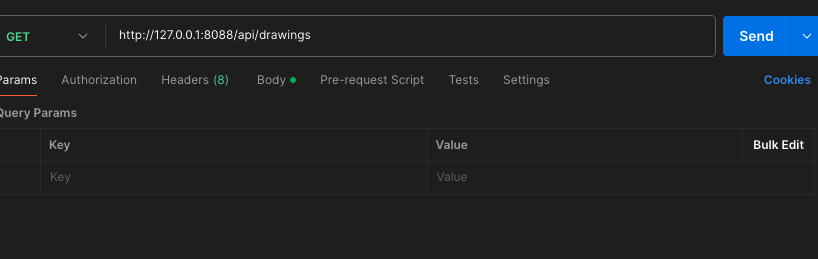
- In Postman, show URL request and Body requirements for GET, POST, and UPDATE methods.
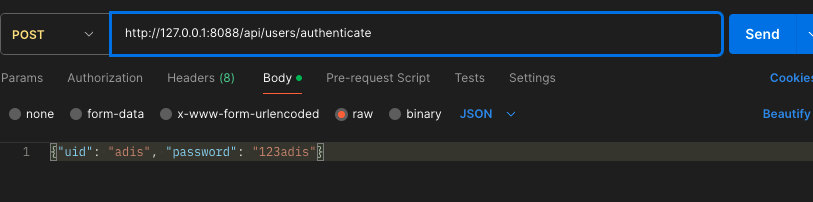
Here is the post method, in this case it is getting the username for the login of our datastructures project.
- In Postman, show the JSON response data for 200 success conditions on GET, POST, and UPDATE methods.
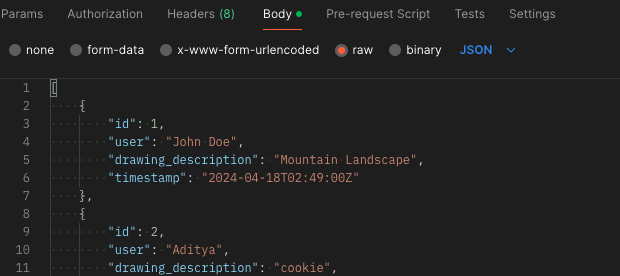
Here is the table being shown through the get method, and the body with all the information into the table.
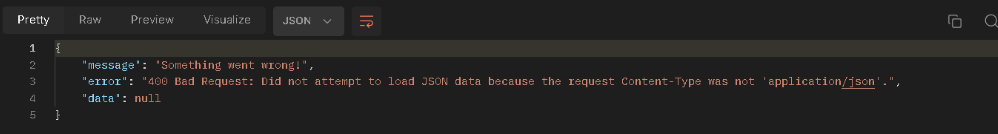
- In Postman, show the JSON response for error for 400 when missing body on a POST request.
- In Postman, show the JSON response for error for 404 when providing an unknown user ID to a UPDATE request.
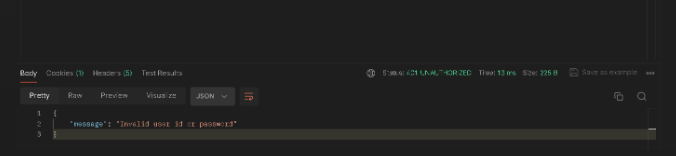
Here is the JSON responding for the different errors, which are created when the user doesn’t enter valid data.
Frontend
Blog JavaScript API fetch code and formatting code to display JSON.
- In Chrome inspect, show response of JSON objects from fetch of GET, POST, and UPDATE methods.
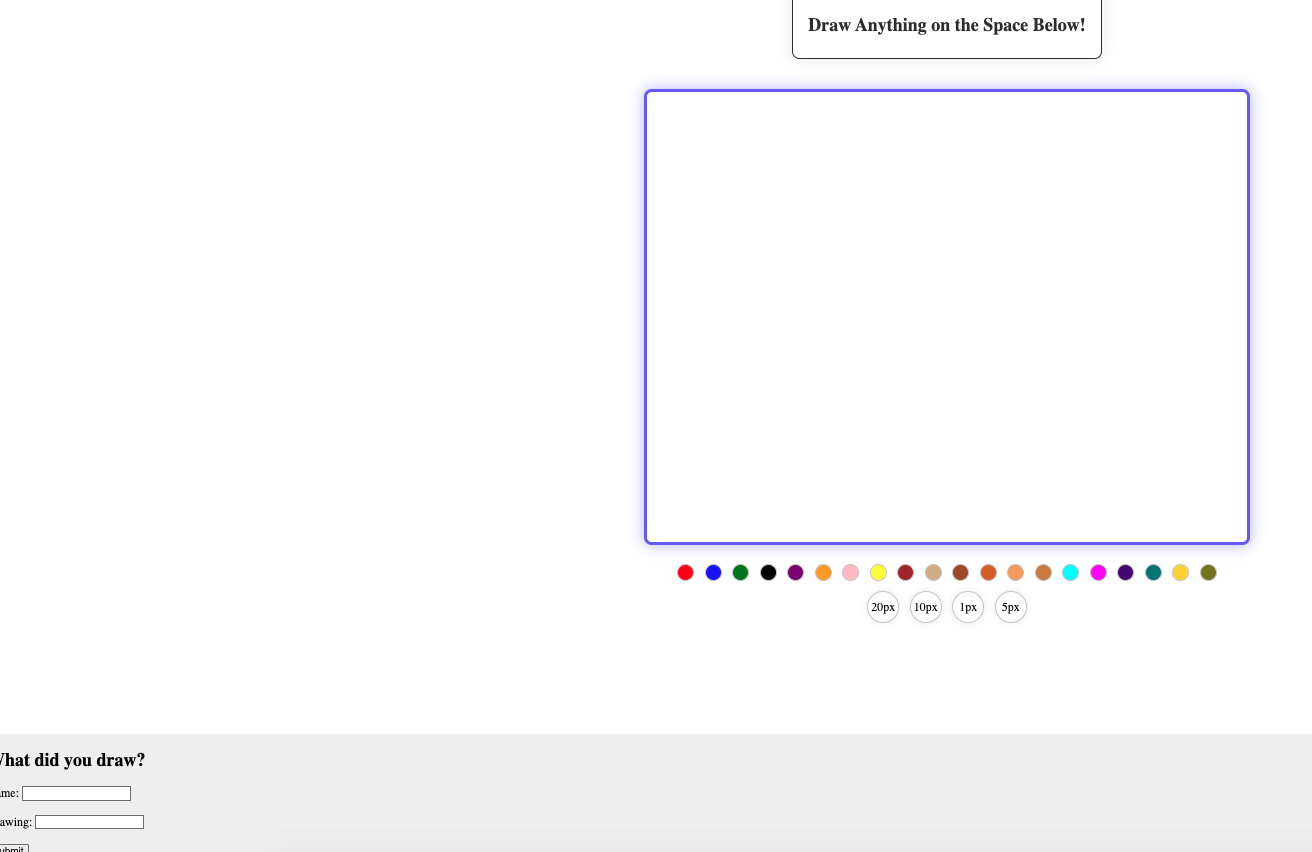
- In the Chrome browser, show a demo (GET) of obtaining an Array of JSON objects that are formatted into the browsers screen.
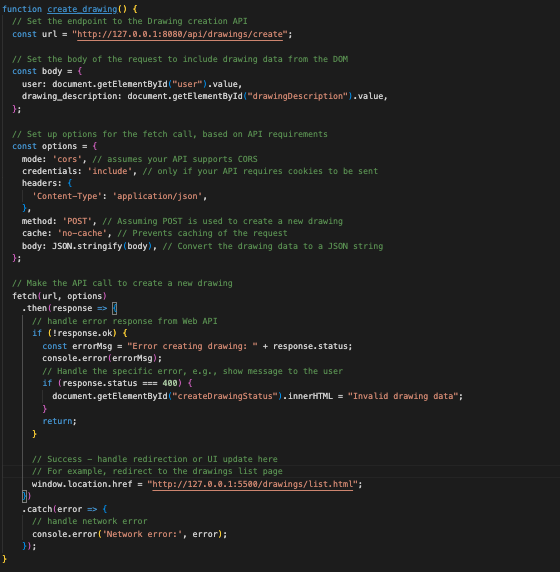
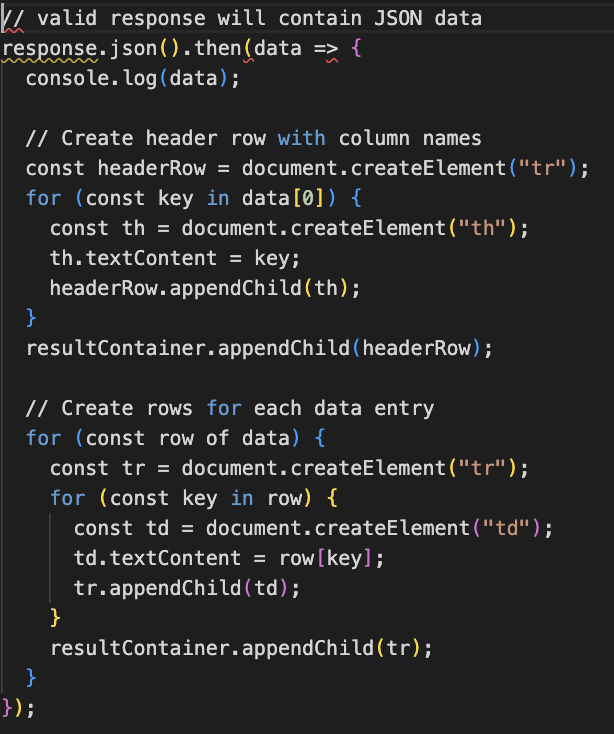
- In JavaScript code, describe fetch and method that obtained the Array of JSON objects.
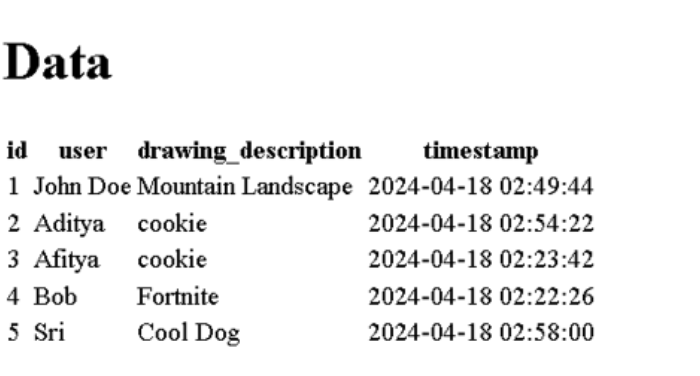
Here is the data being displayed onto the browser after the code in the screenshot before has been written
The fetch(url, authOptions) function initiates a request to the backend server at http://127.0.0.1:8088, appending /api/drawings/authenticate to the base URL to carry out user authentication. Upon successful authentication, users are granted access to the system and redirected to a web page that displays the user database. For the retrieval of the actual user data in JSON format, the function calls http://127.0.0.1:8088/api/drawings/. Once this data is obtained through a second fetch operation, it is organized into an HTML table format on the browser, presenting the information in a structured manner similar to an SQLite database table.
- In JavaScript code, show code that performs iteration and formatting of data into HTML.
SHows the iteration by the for loop as it creates rows of data auntil a certain condition is met, int his case if the drawing is enough characters.
-
In the Chrome browser, show a demo (POST or UPDATE) gathering and sending input and receiving a response that show update. Repeat this demo showing both success and failure.

-
In JavaScript code, show and describe code that handles success. Describe how code shows success to the user in the Chrome Browser screen.
If you enter the same name and descprition or use the login, it will redict to the db displayed, but if you enter something less than one character, then it will show 401, but if u enter something new then itll be added to the db
Optional/Extra, Algorithm Analysis
In the ML projects, there is a great deal of algorithm analysis. Think about preparing data and predictions.
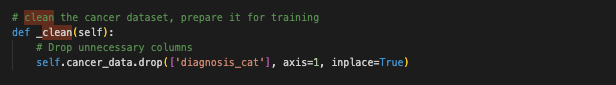
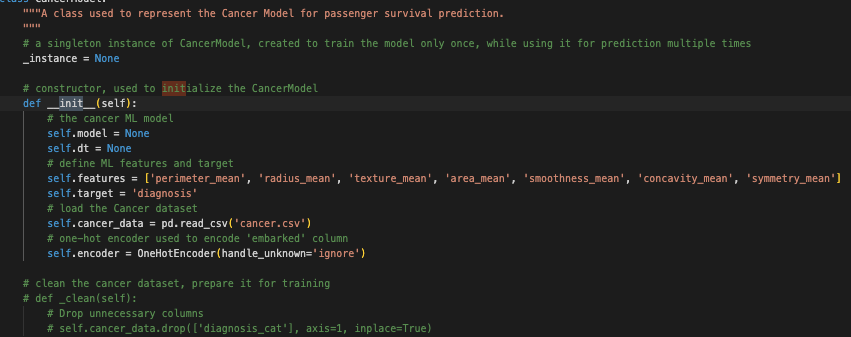
- Show algorithms and preparation of data for analysis. This includes cleaning, encoding, and one-hot encoding.
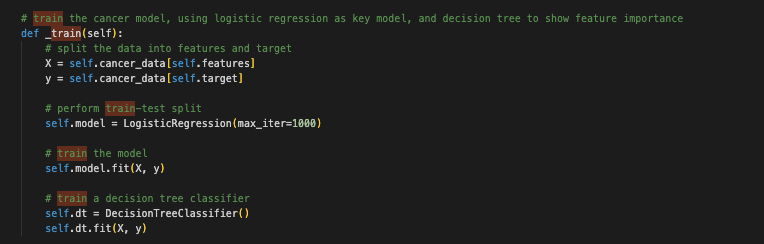
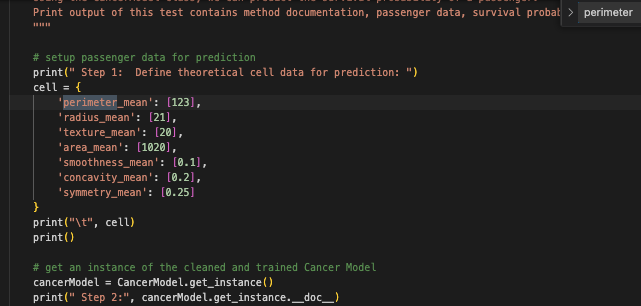
- Show algorithms and preparation for predictions.
- Discuss concepts and understanding of Linear Regression algorithms.
Linear regression examines the correlation between two variables, often denoted as x and y. Within a substantial dataset, typically organized in a pandas dataframe, this method seeks to identify and represent this relationship graphically as a line of best fit on a scatterplot. To optimize the precision of the model, the data is usually split into training and testing sets, with 80% allocated for training and the remaining 20% for testing. The training phase involves calculating the line of best fit based on the training data. Once the model is trained, it uses this line to predict y values from the test set of x values. This predictive model is an instance of supervised learning since it relies on labeled data to learn the correlation.
- Discuss concepts and understanding of Decision Tree analysis algorithms.
Decision Trees primarily function as tools for classification and regression tasks, often employing methods like logistic regression. The process begins at the root node, where the entire dataset is initially placed. The algorithm then divides the dataset into smaller groups using specific criteria to create new nodes. This division continues, segmenting the data further according to the attributes’ potential values. This sequential splitting carries on until a predetermined stopping condition is met, culminating in the creation of leaf nodes. These final nodes represent the outcomes produced by the decision tree.